# Kmeans
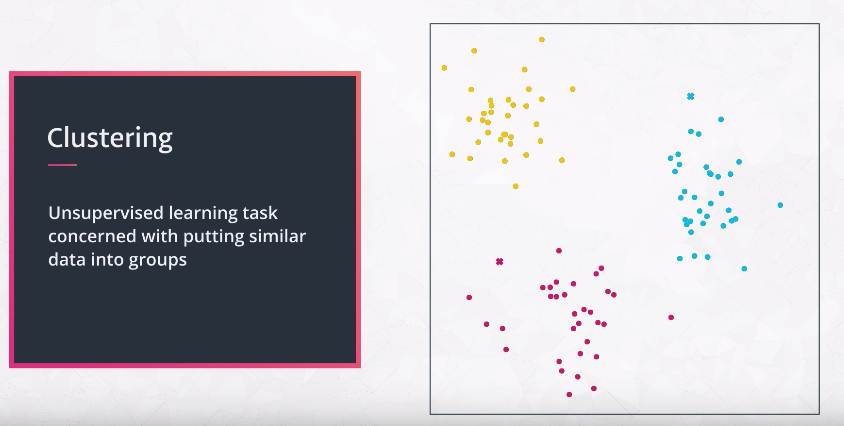
unsupervised learning task concerned with putting similar data into groups
In the K-means algorithm k represents the number of clusters you have in your dataset.
k-means clustering aims to partition n observations into k clusters in which each observation belongs to the cluster with the nearest mean, serving as a prototype of the cluster.
# Algorithm
- Choose the k number of clusters and determine their centroids
- Assign each data point to its nearest centroid using distance measures
- Recalculate the new centroids and again assign each data point to its nearest centroid
- Repeat step 3 and 4 until centroids do not change or no change in criterion function (J)
Image References (opens new window) 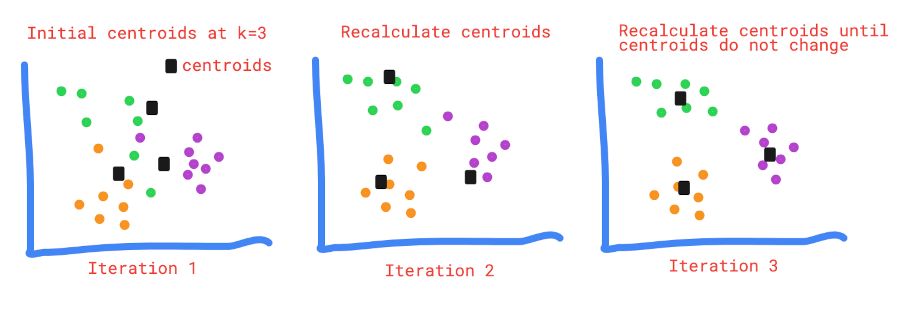
# Cluster Initialization Step
random Choose random point as cluster
kmeans++
- Take one centroid c(1), chosen uniformly at random from the datase
- Take a new centroid c(i), choosing an instance x(i) with probability based on distance to already chosen centroids. This probability distribution ensures that instances farther away from already chosen centroids are much more likely be selected as centroids.
- repeat step above
# Choosing K
six clusters
seven clusters
# Evaluating Clusters
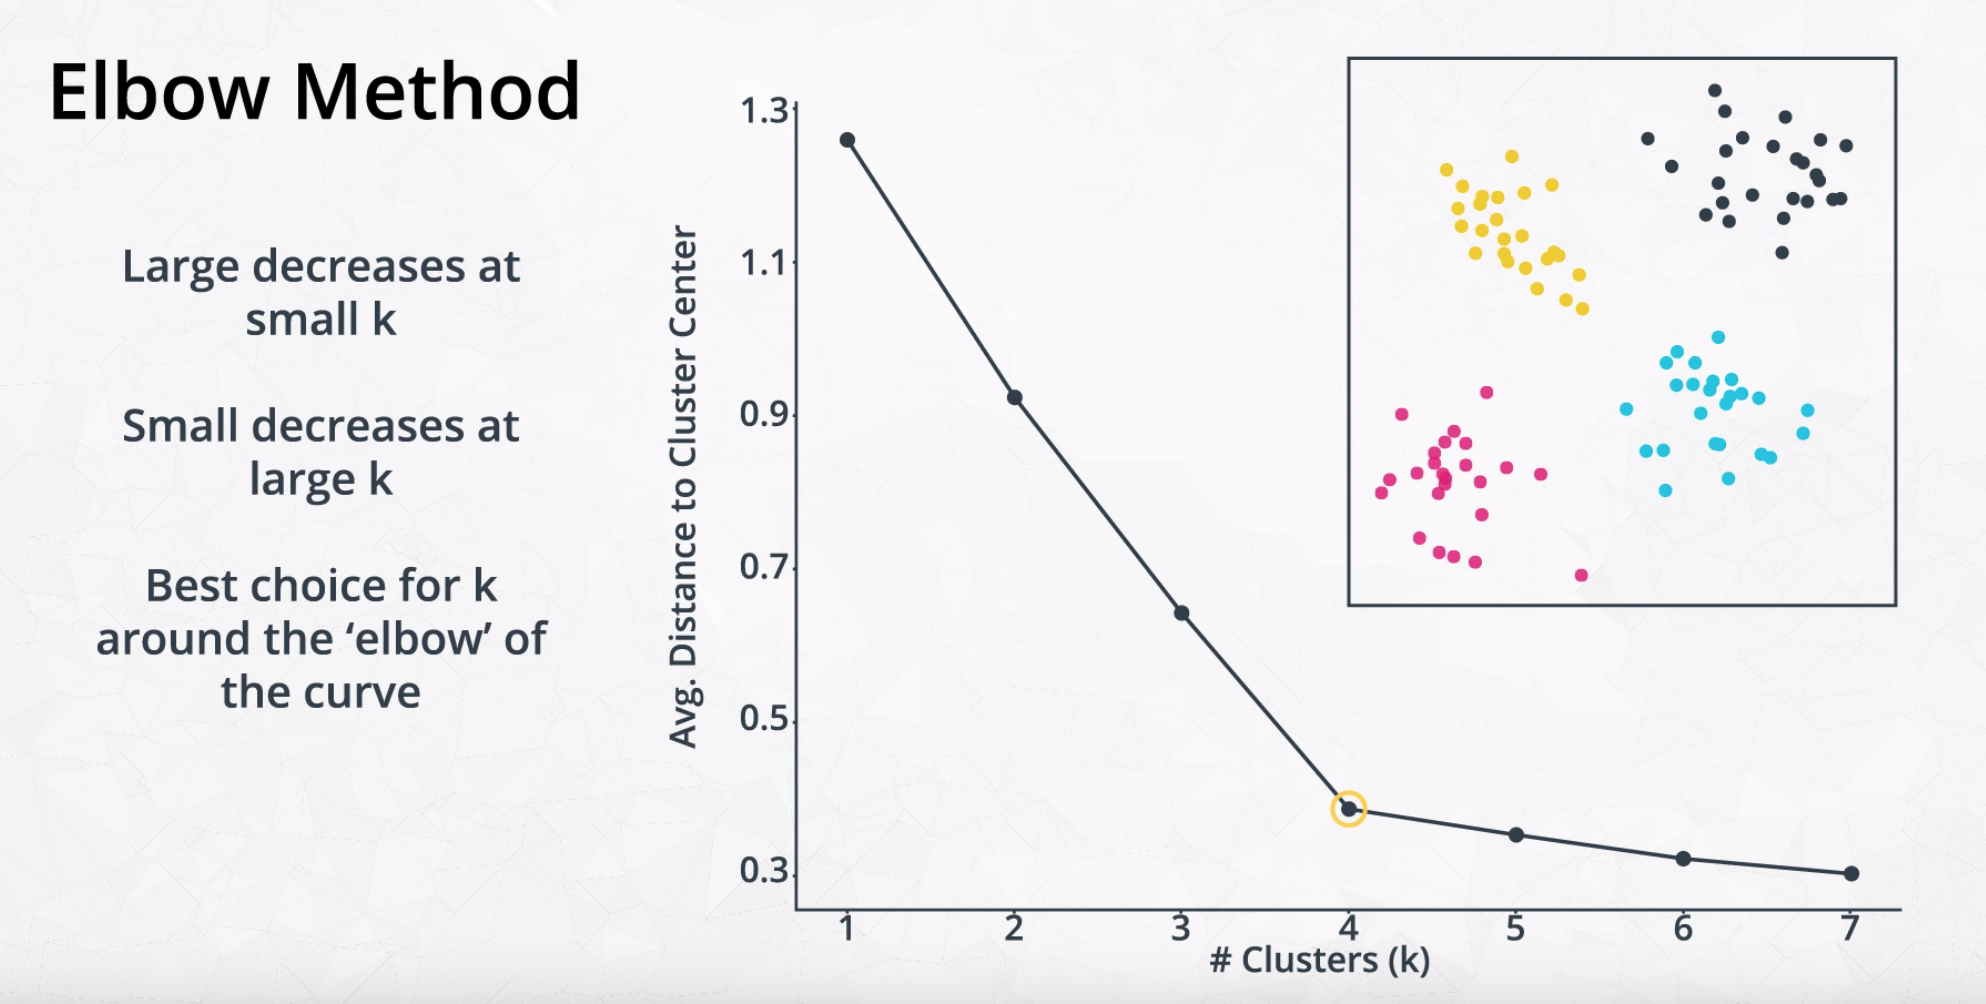
# Elbow method:
create a plot of the number of clusters (on the x-axis) vs. the inertia.
Inertia measures how well a dataset was clustered by K-Means. It is calculated by measuring the distance between each data point and its centroid, squaring this distance, and summing these squares across one cluster.
The average distance will always decrease with each additional cluster center. However, with fewer clusters, those decreases will be more substantial. At some point, adding new clusters will no longer create a substantial decrease in the average distance. This point is known as the elbow.
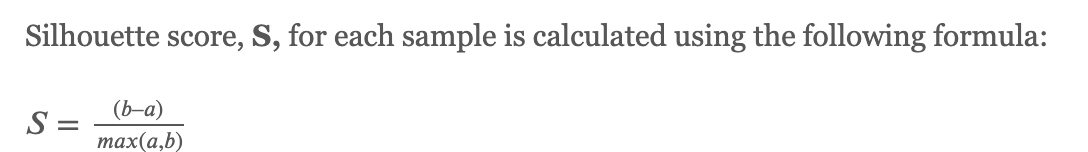
# Silhouette Score
Another method to evaluate the cluster is to look at the Silhouette score.
It looks at how well samples are clustered with other samples that are similar to each other.
The Silhouette score is calculated for each sample of different clusters.
In order to calculate the Silhouette score for each observation / data point, the following distances need to be found out for each observations belonging to all the clusters:
- mean intra-cluster distance (a) :
Mean distance between the observation and all other data points in the same cluster. The mean distance is denoted by a.
- mean nearest-cluster distance (b) :
Mean distance between the observation and all other data points of the next nearest cluster. The distance is denoted by b
The value of Silhouette score varies from -1 to 1.
If the score is 1, the cluster is dense and well-separated than other clusters.
A value near 0 represents overlapping clusters with samples very close to the decision boundary of the neighbouring clusters.
A negative score [-1, 0] indicate that the samples might have got assigned to the wrong clusters.
Silhouette Analysis for 2, 3, 4, 5 Clusters
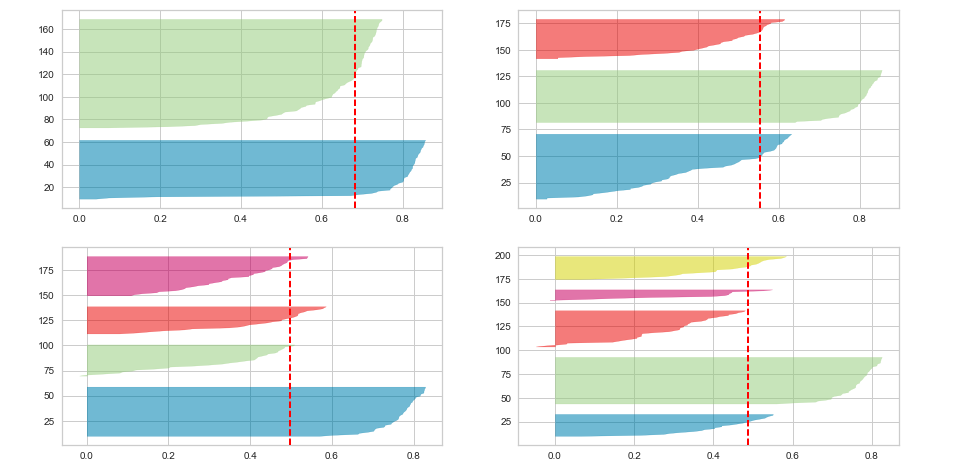 Plotting Silhouette score fo every instance.
The value of n_clusters as 4 and 5 looks to be suboptimal for the given data due to the following reasons:
- Presence of clusters with below average silhouette scores
- Wide fluctuations in the size of the silhouette plots.
- The thickness of the silhouette plot representing each cluster also is a deciding point
For plot with n_cluster 3 (top right), the thickness is more uniform than the plot with n_cluster as 2 (top left) with one cluster thickness much more than the other. Thus, one can select the optimal number of clusters as 3.
Refernce KMeans Silhouette Score Explained with Python Example (opens new window)
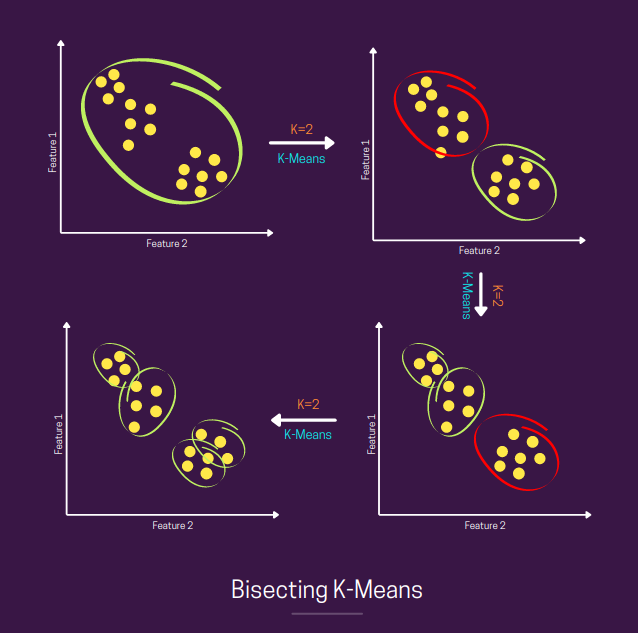
# Bisecting K-means
similar to K-means.
- Initialize K=2 centroids
- apply regular K-means with K=2.
- Choose the cluster with maximum variance or the spread-out cluster and repeat process on cluster
# Code
# Using Scikit Learn
from sklearn.cluster import KMeans
import numpy as np
model = KMeans(n_clusters=4)
model.fit_transform(data)
labels = model.predict(data)


# Obtain a score related to the model fit
score = np.abs(model.score(data))
# Implementation
- Randomly place k centroids amongst your data.
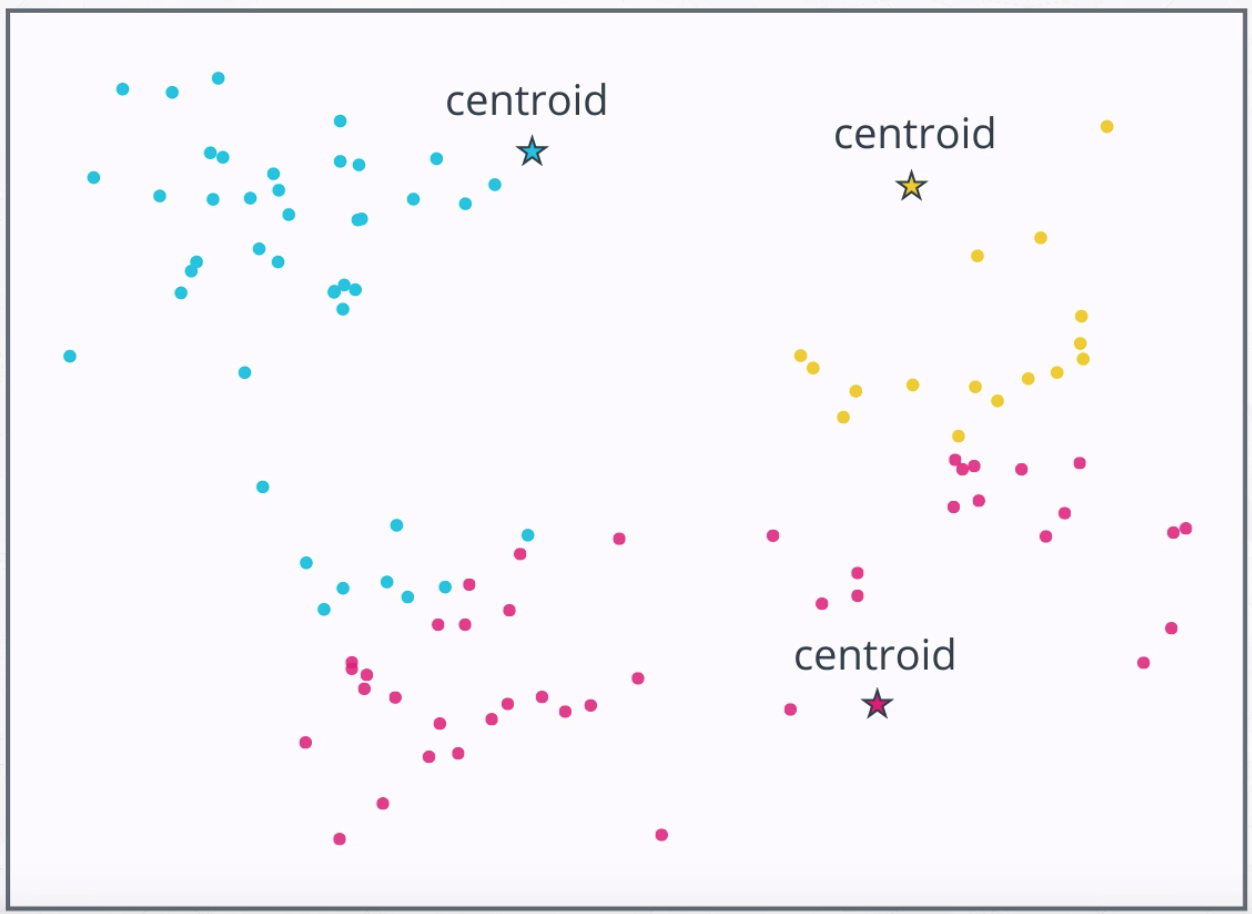
Then within a loop until convergence perform the following two steps:
Assign each point to the closest centroid.
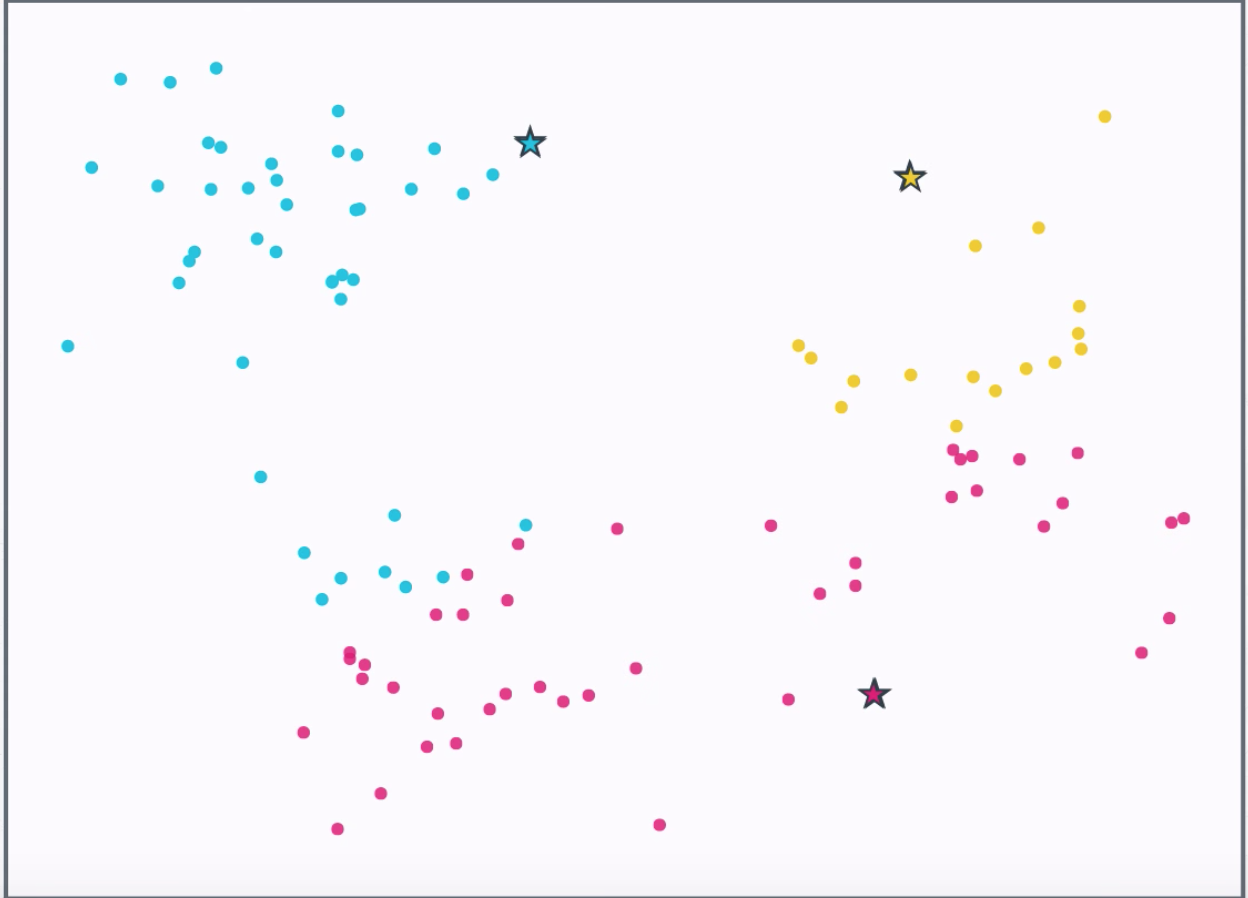
Move the centroid to the center of the points assigned to it.

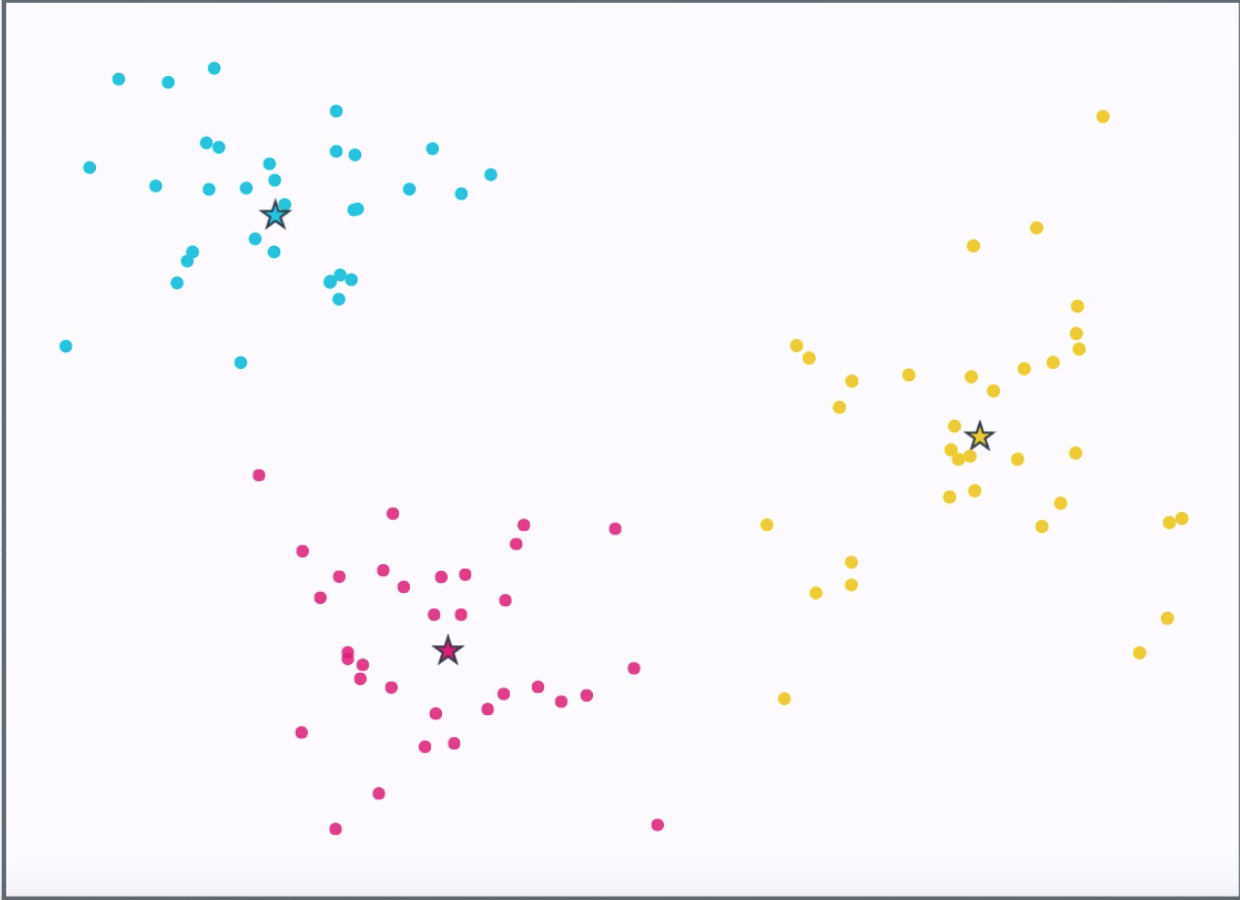
At the end of this process, you should have k-clusters of points.
# Repeated Runs
If you run kmeans, multiple times you will possibly get different clusters.
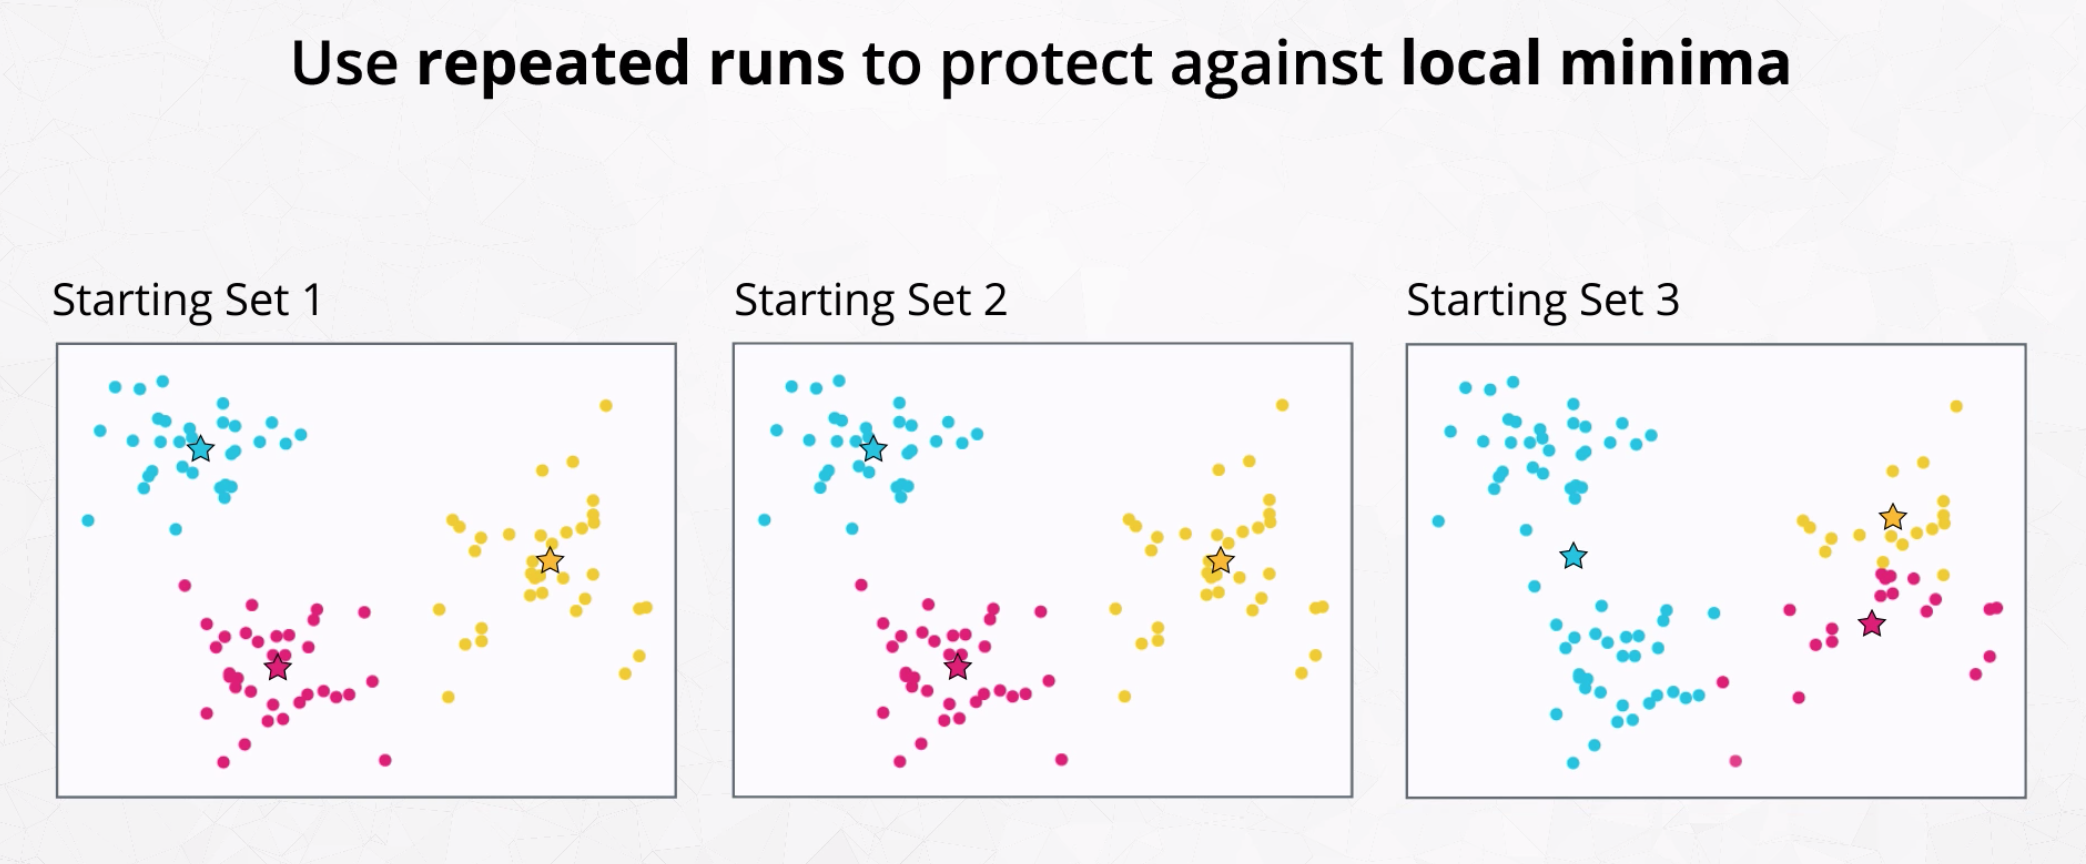 The best grouping is the minimum difference in distance
By default, scikit-learn runs upto 10 iterations
# Feature Scaling
Normalizing or Max-Min Scaling - this type of scaling transforms variable values to between 0 and 1.
Standardizing or Z-Score Scaling - this type of scaling transforms variable values so they have a mean of 0 and standard deviation of 1.
# Downside of Kmeans
Kmeans only works if you know the number of K.
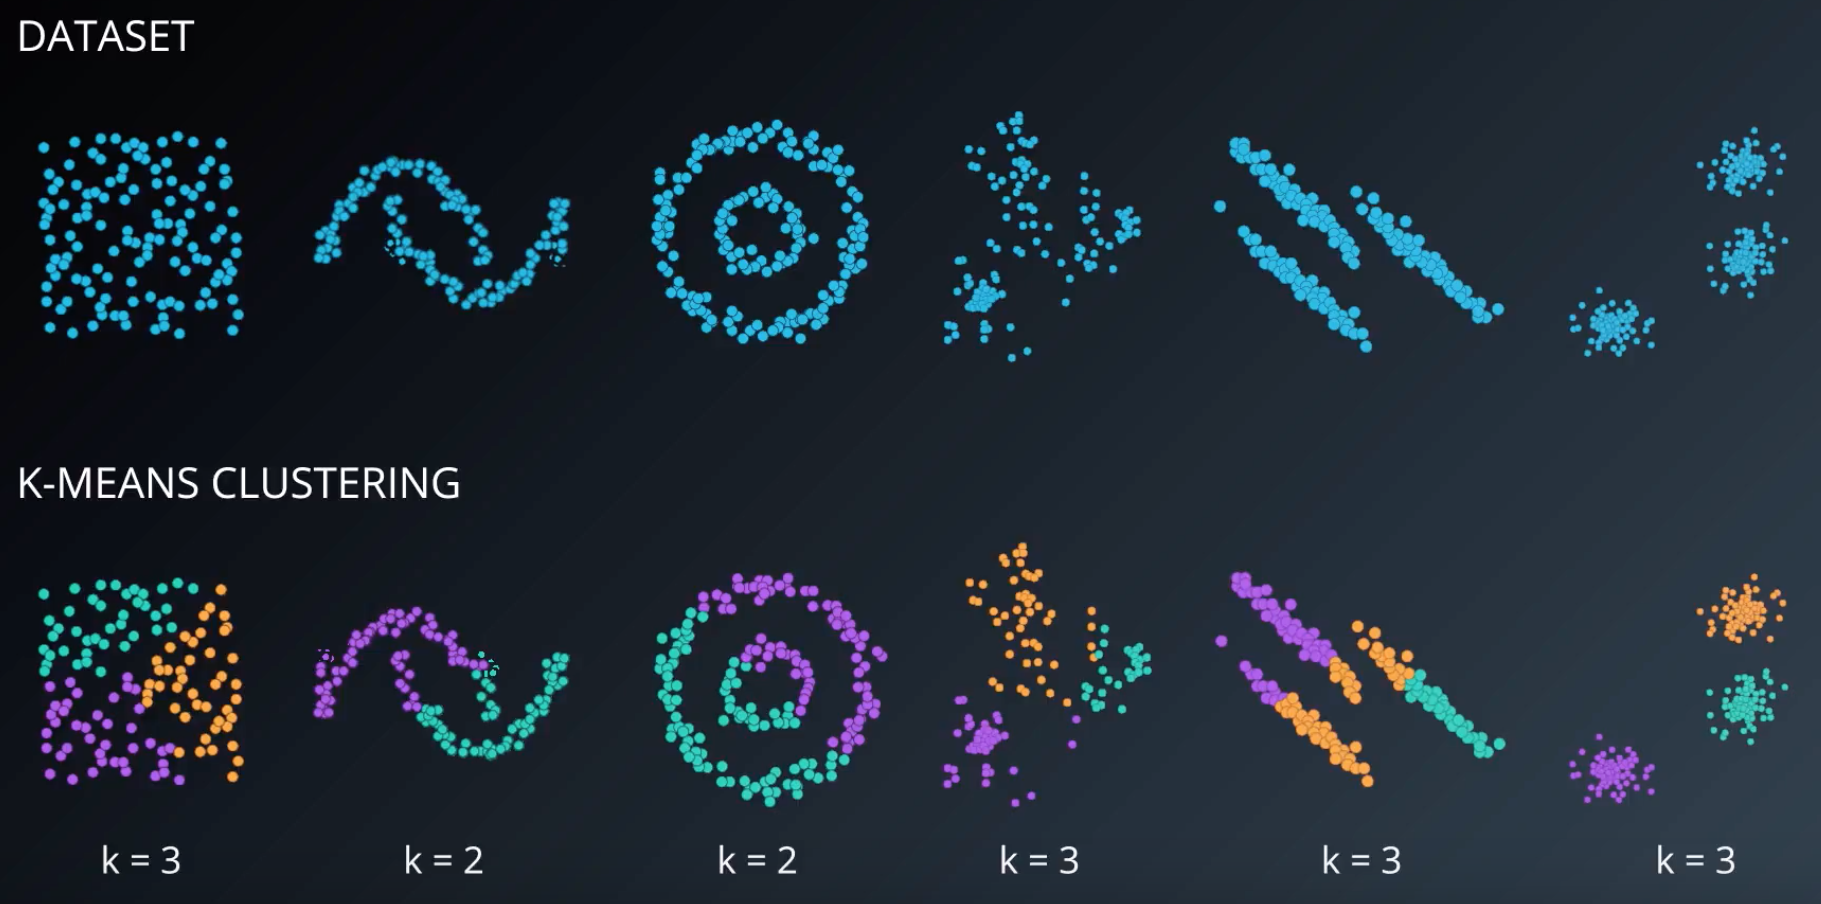
Kmeans also only works if you the data can be described by clusters that are circular or spherical in hiigher dimesion.
K-Means doesn't work for clusters have different diameters because it only cares about when assigning an instance to a cluster is the distance to the centroid.
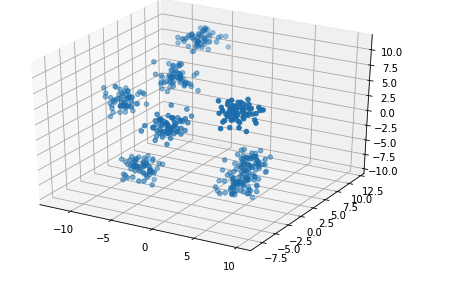
Sample dataset and kmeans performances