# Metrics
# Root Mean Squared Error (RMSE)
Common perfomance measure metric for regression tasks.
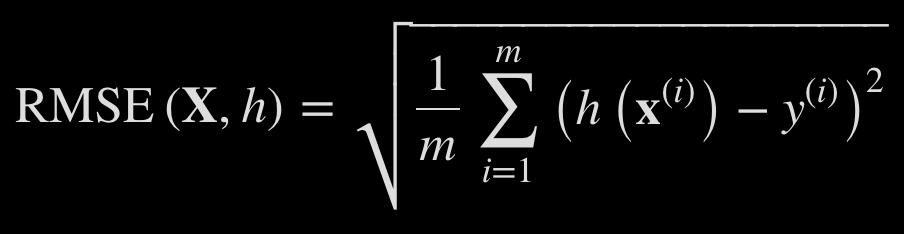
m = number of samples
x^i = vector of all feature values
h = prediction functions
Because we are squaring differences, RMSE is sensitvie to outliers.
# Mean Absolute Error (MAE)
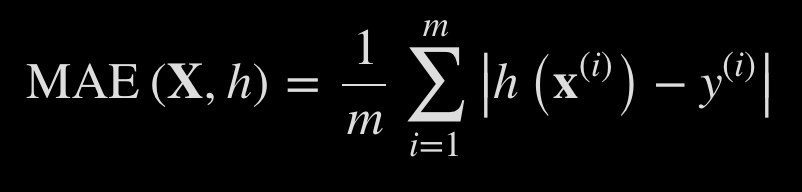
Similar to RMSE, but not squared. Less sensitive to outliers.
# Confusion Matrix
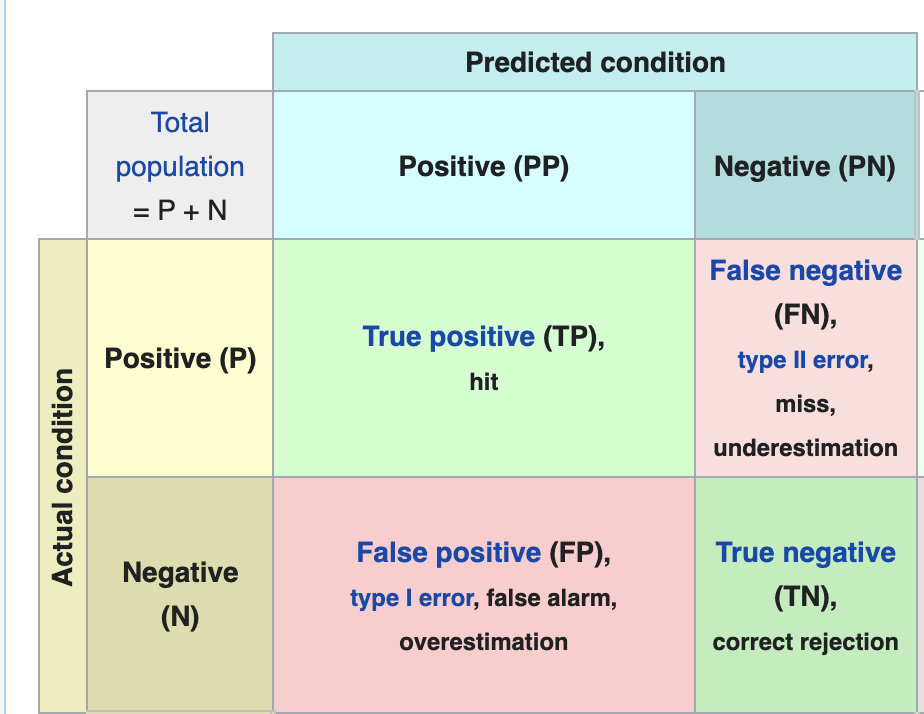
rows are actual classes, columns are predicted classes.
Image Reference: Wikipedia (opens new window)
>>> from sklearn.metrics import confusion_matrix
>>> y_true = [2, 0, 2, 2, 0, 1]
>>> y_pred = [0, 0, 2, 2, 0, 2]
>>> confusion_matrix(y_true, y_pred)
# Precision / Recall
precision
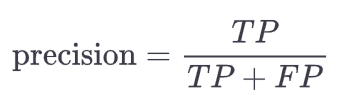
You can get perfect precision, by only making one single positive prediction and ensure it is correct.
so TP=1/1 and FP will be 0
recall
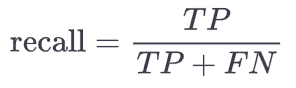
>>> from sklearn.metrics import precision_score, recall_score
>>> precision_score(y_train, y_train_pred)
0.7290850836596654
>>> recall_score(y_train, y_train_pred)
0.7555801512636044
You can plot precision and recall to decide what threshold to use.
# F1 score

Single metric that combines precision and recall.
>>> from sklearn.metrics import f1_score
>>> f1_score(y_train, y_train_pred)
# ROC Curve
# Correlation
Standard Coorleation also calleds Pearson's r.
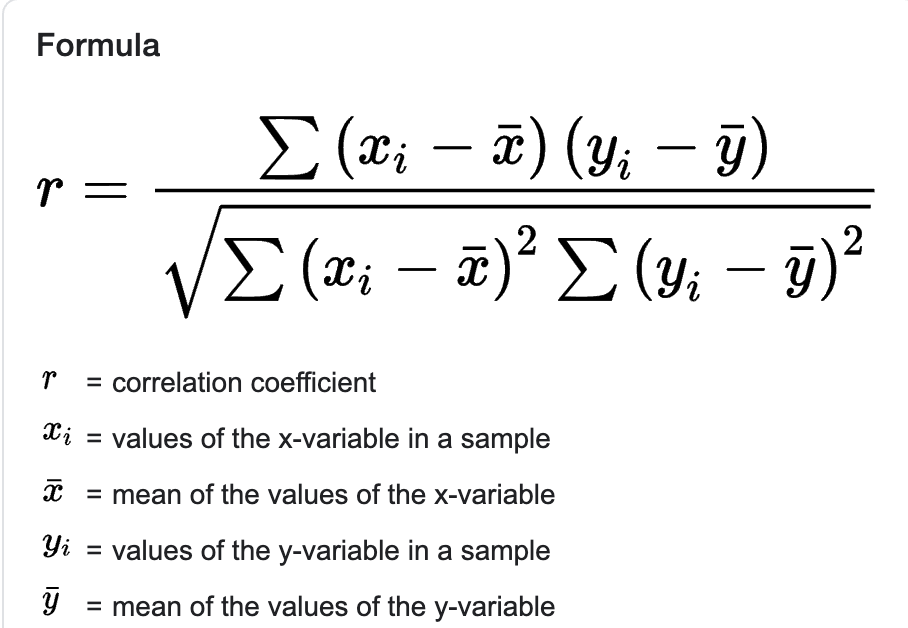
Range from -1 to 1. A correlation of 0 , just means that there is no linear correlation.
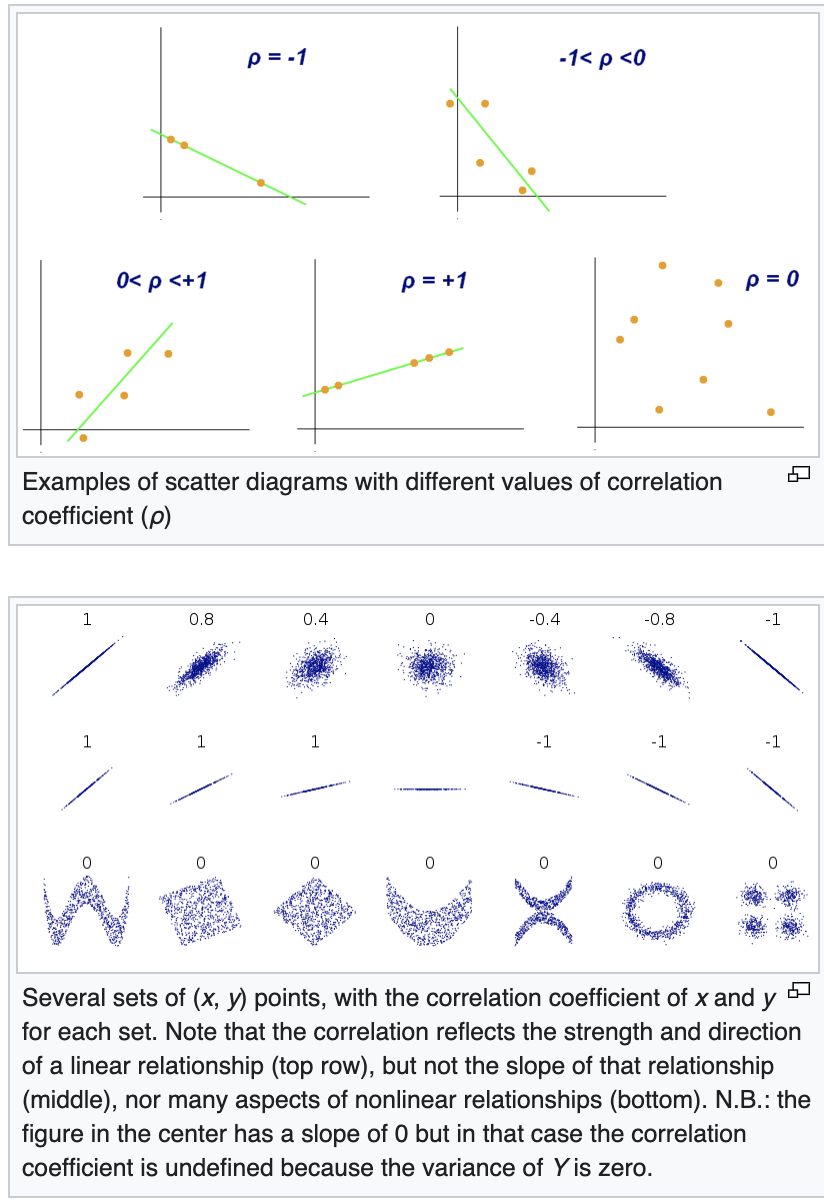
Source: Wikipeida Pearson Correlation Coefficient (opens new window)
Strong correlation is considered : 0.5 - 1.0 or -0.5 to -1.0 can be computed as
df.corr()